Komitmen Universitas Gadjah Mada untuk menjadi The Leading Green Campus diwujudkan dengan mengikuti UI GreenMetric 2018. Keikutsertaan UGM dalam UI Green Metric 2018 merupakan yang pertama kali sejak gagasan ini dimulai pada 2010. Prestasi ditorehkan oleh UGM karena pada keikutsertaan yang pertama, UGM berhasil meraih peringkat 6 Nasional dan peringkat 91 dunia dari 719 perguruan tinggi yang turut serta.
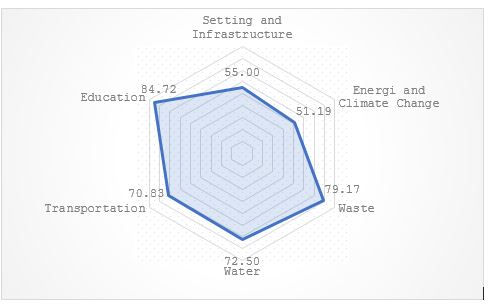
Komponen penilaian yang diukur dalam UI GreenMetric terdiri dari 6 kategori, yaitu infrastruktur, energi dan perubahan iklim, pengelolaan sampah, penggunaan air, transportasi, dan edukasi. Universitas Gadjah Mada mendapatkan peringkat 1 Nasional untuk kategori Waste (penanganan limbah) dan peringkat 3 Nasional untuk kategori Transportation. Hasil yang diraih oleh Universitas Gadjah Mada secara umum adalah sebagai berikut,
Hasil Keseluruhan
| Kategori | Poin | Poin Maksimal | Persentase |
|---|---|---|---|
| Penataan dan Infrastruktur | 825 | 1500 | 55.00 |
| Energi dan Perubahan Iklim | 1075 | 2100 | 51.19 |
| Pengelolaan Sampah | 1425 | 1800 | 79.17 |
| Penggunaan Air | 725 | 1000 | 72.50 |
| Transportasi | 1275 | 1800 | 70.83 |
| Edukasi | 1525 | 1800 | 84.72 |
| Total | 6850 | 10000 | 68.90 |


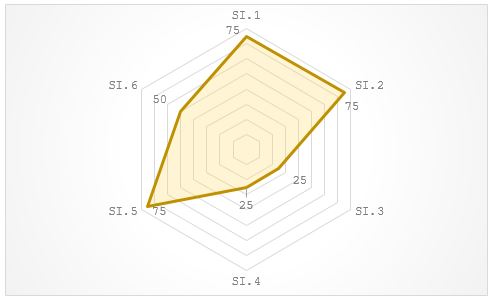
Setting and Infrastructure (Penataan dan Infrastruktur)
| SI.1 | The ratio of open space area towards total area |
| SI.2 | Area on campus covered in forest |
| SI.3 | Area on campus cobered in planted vegetation |
| SI.4 | Area on campus for water absorbance |
| SI.5 | The Ratio of open space area divided campus population |
| SI.6 | University budget for sustainability effort |

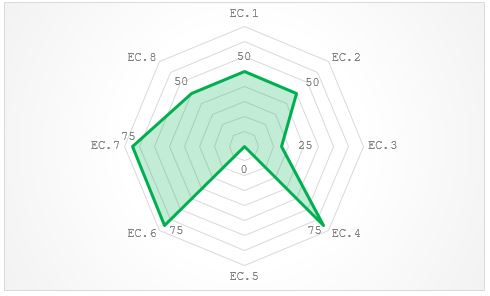
Energy and Climate Change
| EC.1 | Energy Efficient Appliances Usage |
||
| EC.2 | Smart building program implementation |
||
| EC.3 | Number of renewable energy source in campus |
||
| EC.4 | The total electricity usage divided by total campus population |
||
| EC.5 | The ratio of renewable energy production towards total energy usage per year |
||
| EC.6 | Element of green building implementation |
||
| EC.7 | Greenhouse gas emission reduction program |
||
| EC.8 | The ratio of total carbon footprint divided campus population |
||

Waste
| WS.1 | Recycling program for university waste |
| WS.2 | Program to reduce the use of paper and plastic in campus |
| WS.3 | Organic waste treatment |
| WS.4 | Inorganic waste treatment |
| WS.5 | Toxic waste treatment |
| WS.6 | Sewerage disposal |

Water
| WR.1 | Water conservation program |
||
| WR.2 | Water recycling program |
||
| WR.3 | The use of water efficient appliances |
||
| WR.4 | Piped water consumed |
||

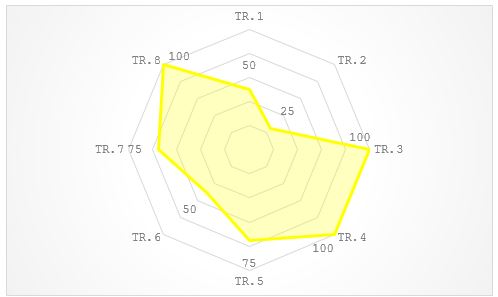
Transportation
| TR.1 | The ratio of total vehicles (racs and motorcycles) divided by total campus population |
| TR.2 | Shuttle services |
| TR.3 | Zero Emission Vehicles (ZEV) policy on campus |
| TR.4 | The ratio of Zero Emission Vehicle divided by total campus population |
| TR.5 | Ratio of parking area to total campus area |
| TR.6 | Transportation program designed to limit or decrease the parking area on campus for the last 3 years |
| TR.7 | of transportation initiatives to decrease private vehicles on campus |
| TR.8 | Pedestrian policy on campus |

Education
| ED.1 | Ratio of Sustainability Courses towards Total Courses/ Modules |
||
| ED.2 | The ratio of sustainability research funding towards total research funding |
||
| ED.3 | sustainability publications |
||
| ED.4 | sustainability events | ||
| ED.5 | sustainability student organizations |
||
| ED.6 | sustainability websites |
||
| ED.7 | sustainability report | ||
